How to Get More from Your Visitor Data
By Rashi Maithul · · 9 min read
“We do use our data. But we know we could do more.”
If I had a pound for every time I’d heard it, I could fund a small exhibition. A very small one. Probably about spoons.
The conversation usually goes like this.
Me: How are you using visitor data to make decisions?
Them: Quite a lot. Footfall, ticket sales, web analytics, a visitor survey. We know which events sell out.
Me: So what’s missing?
Them: We know we could do more with it. We’re just not sure what “more” looks like.
The challenge is rarely a lack of data. It’s uncertainty about what else that data could help you understand, and which decisions it could make easier.
What “doing more” actually means
Doing more means moving along a simple chain:
- Collect: know what happened.
- Analyse: spot patterns in what happened.
- Explain: form a plausible reason for those patterns.
- Decide: choose what to change, test or prioritise.
- Learn: check whether it made a difference.
Most organisations are brilliant at the first two. The value sits in the last three, and another dashboard rarely gets you there. Better questions usually do.
You’re in good company. In Manifesto’s 2025 Curating Connection research with 2,000 UK visitors and 300 sector leaders, 87% of leaders said they knew their audiences, yet 23% admitted they weren’t using data effectively to make decisions. One in five named internal silos as a barrier to engagement (Museums Association, November 2025). The appetite is there. The method is what’s missing.
The Visitor Data-to-Decisions framework
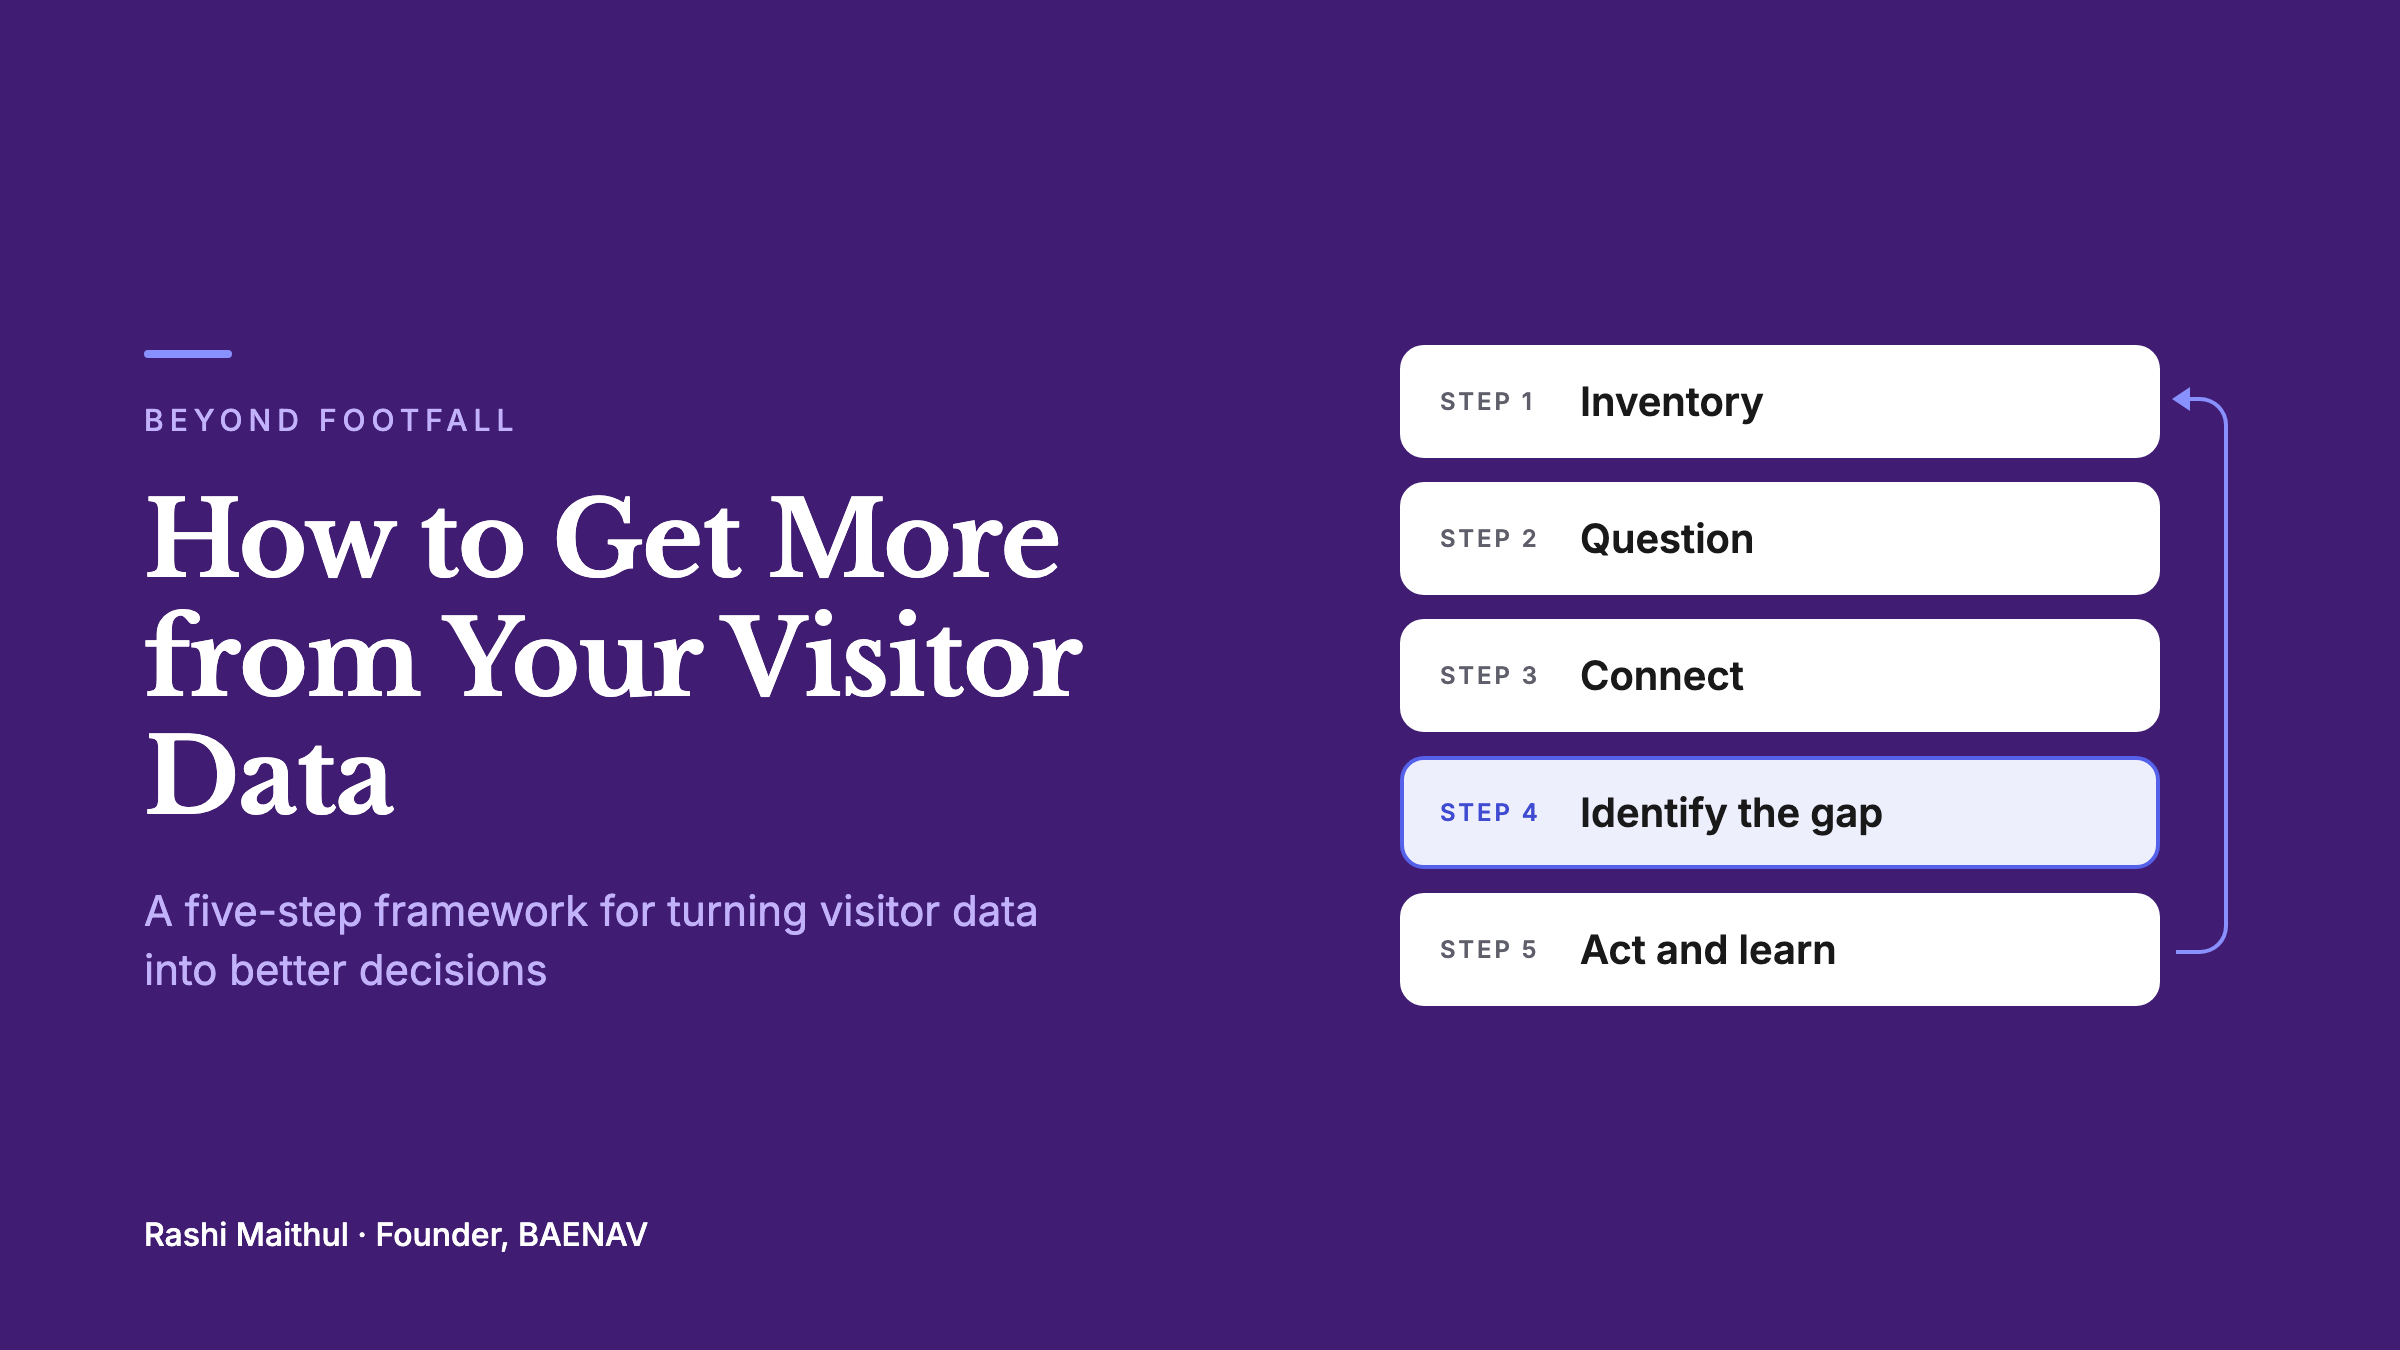
To make “doing more” practical, I use a simple five-step framework. Each step answers one question, and the rest of this article walks through them in order.
- STEP 1, Inventory: What data do we already have? Footfall, tickets, web, feedback
- STEP 2, Question: Which decisions do we face? Programming, marketing, access
- STEP 3, Connect: What can it tell us together? Patterns, trends, relationships
- STEP 4, Identify the gap: What can’t we explain yet? Motives, intent, friction, needs
- STEP 5, Act and learn: What will we change or test? Decision, owner, outcome, review
Each outcome raises the next question
Read it left to right, then round again, every decision you test produces new evidence, and new questions.
It’s the framework I use with venues, not an industry standard. It starts with what you have and ends with something you do.
Step 1: Inventory. What do you already have?
Useful evidence often sits in separate systems, owned by different teams, and rarely gets read side by side. The sector already tracks a lot, VisitEngland’s attractions survey, with returns from 1,373 English attractions for 2024, records visitor numbers alongside admission fees and visitor profiles (VisitBritain).
| Data you may already have | What it tells you | Decisions it can inform |
|---|---|---|
| Footfall and admissions | How many visit, and when | Opening hours, staffing, capacity |
| Ticketing and bookings | What sells, and when people book | Pricing, forecasting, new products |
| Website and social analytics | What people look at before visiting | Campaigns, booking journeys |
| Surveys and feedback | What visitors say they enjoyed or needed | Service, interpretation, access |
| Retail, catering and spend | Where revenue comes from | Range, pricing, commercial plans |
| Events and membership | Who comes back, and to what | Programming, retention |
| Observation and visitor flow | How people move through a space | Wayfinding, layout, bottlenecks |
| Destination footfall | Movement across a town or place | Place marketing, event coordination |
A small museum may only have ticketing and an occasional survey. A BID may lean on counters and business feedback. That’s fine. The point is to see what you have. Somewhere in your organisation there’s a file called Visitor_Survey_FINAL_v3_actually_final.xlsx. Congratulations, that’s your starting point.
Try this: list each source, who owns it and how often it’s reviewed. Then ask one question of each, what can this tell us confidently, and what can’t it? Knowing how many people saw an exhibition says nothing about whether they understood it, enjoyed it or hit a barrier on the way round.
Step 2: Question. Start with the decision, not the data
Work backwards from the decisions you need to make. Most fall into five areas. In each one, your existing data answers part of the question and leaves the next part open.
- Programming and interpretation. What you’ve got: Attendance by exhibition, bookings, how long people linger. Still wondering: What do people find interesting, confusing or worth more time?
- Marketing and audiences. What you’ve got: Web traffic, campaigns, booking sources, CRM. Still wondering: What motivates people to come, and what stops interested people?
- Visitor experience and access. What you’ve got: Complaints, feedback, staff notes, access audits. Still wondering: Where do visitors get stuck, and which needs go unmet?
- Commercial performance. What you’ve got: Retail, catering, upgrades, tour sales. Still wondering: What are visitors interested in but not buying?
- Destination and place. What you’ve got: Footfall counters, events, business feedback. Still wondering: What keeps people exploring, and why do they skip some areas?
The same dataset can serve several decisions, and one decision usually needs several datasets. Good evaluation practice works this way too, Museums Galleries Scotland advises setting aims first and letting them guide the method (Museums Galleries Scotland).
Try this: write down three decisions you need to make in the next six months, and the data you’d want for each. The gaps show up fast.
Step 3: Connect. What can your data tell you together?
Patterns often only appear when two datasets sit side by side:
- Footfall + weather + events: did attendance dip because of the exhibition, a local event or the weather? Before you blame the exhibition, check whether it rained. It’s Britain. It probably did.
- Web analytics + bookings: where do people drop out of the booking journey?
- Attendance + feedback: are the busiest galleries also the ones visitors rate as most rewarding?
- Footfall + spend: when numbers rise, does spend per visitor rise too?
Outside evidence helps you know where to look. ROLLER’s 2025 Pulse Report surveyed 2,000 attraction visitors in the UK, US and Australia and found 62% had abandoned an online booking at some point because of hidden fees or a poor experience (IAAPA). The same research found 90% of guests prefer to book online and 97% plan their visit at least a day ahead, with hidden fees and unclear pricing the biggest frustration (Blooloop). Put your own drop-off data beside that and you have a shortlist to test.
For audiences development rather than bookings, Arts Council England’s free Illuminate platform lets you gather survey and box office data, then benchmark who engages (and who doesn’t) against regional and sector data. If you’re Arts Council-funded, you’re already required to use it, so you may as well enjoy it.
These are leads, not proof. Footfall and sales rising together doesn’t mean one caused the other. Ice cream sales and sunburn rise together too. Neither causes the other. The sun is to blame, which, in this country, makes a nice change.
Step 4: Identify the gap. What can’t your data tell you yet?
This is the turning point. Your everyday numbers show what happened. Some questions it can’t answer on its own.
- What you can measure: How many people visited. What you may still need to understand: Why they chose to come
- What you can measure: Which exhibition was busiest. What you may still need to understand: What visitors found meaningful
- What you can measure: Which web pages people viewed. What you may still need to understand: What questions they still had on arrival
- What you can measure: What visitors said afterwards. What you may still need to understand: What happened during the visit that they never reported
- What you can measure: Which areas were busy. What you may still need to understand: Whether people were engaged, lost or just passing through
Surveys, counters and ticketing still matter. Each gives a different kind of evidence. Museums Galleries Scotland’s guidance puts it simply. counting tells you how many, while watching and talking to visitors helps you understand their views and behaviour (Museums Galleries Scotland).
Imagine visitors spend very little time in one gallery. The data has found a pattern, not a reason. They might find the subject dull, struggle with the displays, be short on time or be heading for the café. (Never underestimate the pull of a decent scone.) Each explanation needs a different fix, and replacing the exhibition could mean paying to solve the wrong problem. A few days of observation or short in-visit conversations can tell them apart.
What more data could you collect?
Only now does new data make sense. Collect to answer a question, not because you can.
- In-visit questions. How: A mobile or chat-style guide, read as overall trends. Helps with: Signage, FAQs, interpretation
- Movement. How: Watching routes, counters, privacy-safe tracking. Helps with: Layout, wayfinding, space
- Motivation. How: Short chats, optional prompts, interviews. Helps with: Audiences, programmes, comms
- Friction. How: Repeat questions, reported difficulties, access barriers. Helps with: Service, access, staff support
- Context. How: Feedback joined to attendance, weather and programme data. Helps with: Explaining changes over time
New sources can add a different view. Historic England compared English Heritage booking records with anonymised mobile data to value historic sites, found the two broadly agreed, and noted mobile data’s potential for free sites with no booking records (Historic England, Research Report 10/2025).
Before collecting anything, check three things. Does it reflect all your visitors, not just the chatty ones? Does it burden visitors? Does it meet UK GDPR? The Information Commissioner’s Office has plain-English guidance.
For GDPR, focus on a few fundamentals, always get clear consent when you collect personal data, only collect what you genuinely need, explain why you are collecting it, and keep it secure. Make sure people know how their data will be used, and give them the option to withdraw consent at any time. These steps help keep your data practices transparent and compliant.
Step 5: Act and learn. Turn evidence into a decision
Insight only counts if it changes what you do. Here’s an illustrative example of the loop closing:
- 01 SIGNAL: Staff keep being asked where an exhibition starts.
- 02 EXISTING EVIDENCE: Survey comments mention confusing signs.
- 03 QUESTION: Is it the signs, the layout or the pre-visit information?
- 04 NEW EVIDENCE: A few days of observing routes, plus a one-question prompt about finding the way.
- 05 DECISION: Test revised signs and clearer directions on the website.
- 06 EVALUATION: Compare direction requests before and after, noting anything else that changed.
Step 1 rule of thumb: three a day means the sign needs work. Thirty a day means it may be pointing at the toilets.
Timing matters too. Museums Galleries Scotland’s guidance warns that evaluation left until the end of a project leaves no time to fix what it finds, and its advice ends on a simple instruction, share your findings and use them to make changes (Museums Galleries Scotland, 2025).
Try this: give every insight four labels, the decision it informs, the action you’ll test, the owner responsible and the outcome you’ll measure. Without them, it’s one more report that gets filed away.
Conclusion: doing more starts with a better question
When someone says, “We use our data, but we could do more,” the answer lies in three questions, what are you trying to decide, what can your data already tell you, and what do you still need to understand?
Start this month. Inventory what you hold, pick three decisions, connect the evidence and list what you still can’t explain. Then decide whether new data is worth collecting. You don’t need a bigger dataset. You need a cup of tea, one honest spreadsheet and three good questions.
Most venues know how many people walked through the door. Far fewer know what those people were wondering once inside. That gap is where the next good decision is hiding.